
Tuesday, November 22, 2011
#45 - Correlation Matrix
A Correlation Matrix displays multiple sets of similar data.
http://genomebiology.com/content/figures/gb-2008-9-8-r129-4-l.jpg
#44 - Similarity Matrix
A Similarity Matrix shows the things that different variables have in common, like the audio similarity matrix below.
 http://www.springerimages.com/Images/ComputerScience/1-10.1007_978-3-642-12337-5_7-8
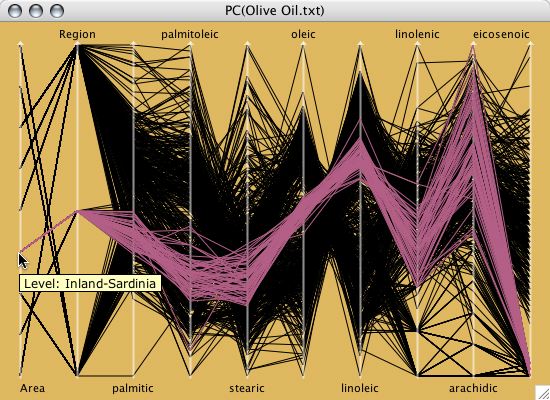
#43 - Parallel Coordinate Graph
Parallel Coordinate Graphs show multiple sets of data in one location, making it easy to read and compare instantly.
 http://www.theusrus.de/Mondrian/
#42 - Windrose
The Windrose seen here is displaying the distribution of wind speed and direction.
 http://www.vistadatavision.com/reports/wind-rose/
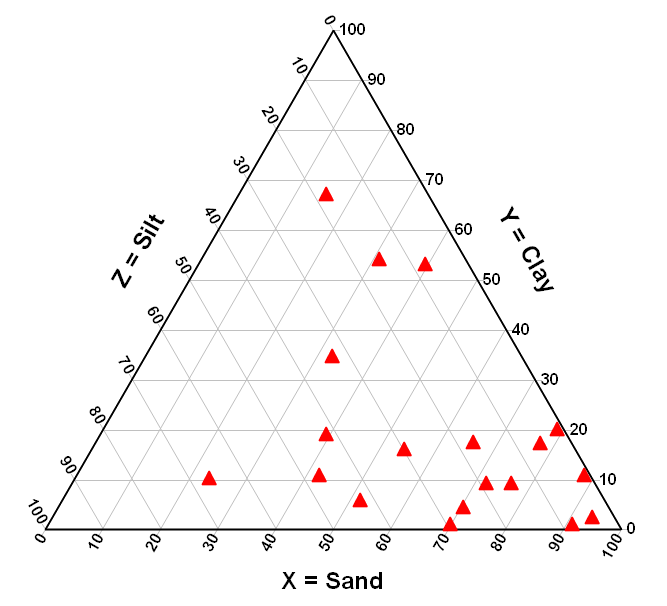
#41 - Triangular Plot
The Triangular Plot uses 3 different variables of data and is generally used in geological studies. The one seen here is plotting silt, clay and sand.
 http://www.dplot.com/triangle-plot.htm
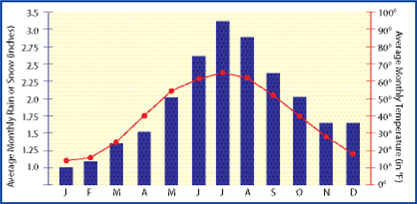
#40 - Climograph
A Climograph shows us the climatic data of a particular place over a specific span of time.
 http://www.jrank.org/history/pages/8346/What-Are-Different-Types-Maps-Graphs.html
#39 - Population Profile
The population profile seen here is basically a bar graph displaying the amount of males and females with age, distributed by age.
 http://www.ifad.org/operations/regional/pf/aids_1.htm
Subscribe to:
Comments (Atom)